
Heart Rate Variability:
What It Really Tells You
(and What It Doesn't)
Wearables have made it easier than ever to track the body – but not every metric is as straightforward as it looks. Smartwatches, rings, and chest straps now put a stream of physiological data at our fingertips – steps, sleep, calories burned, blood oxygen, and heart rate, to name a few. Of all these metrics, heart rate (HR) is the most familiar. It’s simple to measure and easy to understand: it’s just how many times your heart beats each minute.
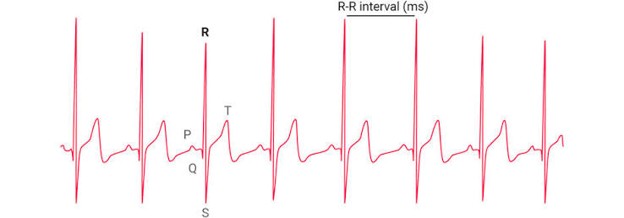
Heart rate variability (HRV), on the other hand, tells a deeper story. Rather than looking at your average heart rate, HRV looks at the tiny variations in timing between each heartbeat. Those small fluctuations offer a window into your nervous system, your stress levels, your recovery, and your overall physical resilience.
But HRV is also far trickier to measure accurately than plain heart rate – which raises an important question: can consumer wearables really capture it with clinical-level precision? Devices like chest straps, finger sensors, smartphone apps, and wrist-based optical sensors all claim to measure HRV, but how do they stack up against the gold standard, an ECG (electrocardiogram)? That’s a question worth understanding before you put too much weight on the number on your wrist.
Can Your Watch Really Measure HRV?
The gold standard for HRV measurement is an electrocardiogram (ECG), which directly records the electrical activity of the heart and can precisely identify the timing between individual beats. Chest straps and other ECG-based devices generally provide the most accurate beat-to-beat data, especially during short, controlled measurements.
Most smartwatches and rings use optical sensors instead. These devices shine light into the skin to estimate changes in blood volume, then use algorithms to calculate pulse timing. This approach can be useful for tracking HRV trends over time, especially when measurements are taken consistently, but it is more vulnerable to factors like movement, poor sensor contact, skin characteristics, and changes in blood flow.
The key point: wearable HRV numbers should be treated as trends, not absolute truths. A reading from your watch may not perfectly match an ECG measurement – but if the device, conditions, and routine stay consistent, changes in your own HRV can still provide valuable insight into recovery, training stress, and overall readiness.
In practice, consistency often matters more than chasing the “perfect” number
1. HRV Is Valuable - But It's Not Simple
At its core, HRV reflects the push and pull between two branches of your autonomic nervous system: the “fight-or-flight” (sympathetic) side and the “rest-and-digest” (parasympathetic) side. Training stress affects autonomic balance, which is one reason HRV has become a popular tool for tracking:
- Recovery
- Training adaptations
- Fatigue
- Readiness for your next session
The challenge is interpreting those changes correctly.
2. Higher HRV Isn't Always Better
It’s tempting to assume that a bigger HRV number always equals better recovery or fitness. In reality, it’s more complicated than that. HRV is influenced by a long list of factors, including:
- How intense and how long your recent activity was
- Your training background and fitness level
- Environmental conditions (heat, altitude, etc.)
- Your own individual physiology
Because of this, two people – or even the same person on two different days – can have identical HRV readings that mean completely different things. That’s why HRV is most useful when interpreted against your own baseline.
3. Context Is Everything
HRV becomes more useful when combined with other indicators. A single number rarely tells the whole story. Instead, coaches and practitioners should weigh HRV alongside:
- Training load
- How fatigued someone feels
- Recent performance
- Overall recovery status
- The individual’s personal history and baseline
The value comes from combining HRV trends with the broader picture of training, recovery, and performance.
4. Consistency Is Key
HRV measurements are sensitive to how and when you take them. To get reliable, comparable data over time, conditions need to stay consistent:
- Same time of day
- Same body position
- Same breathing conditions
- Same measurement protocol
Skip standardization, and you risk comparing apples to oranges from one day to the next.
5. HRV Should Be Personal, Not Universal
There’s no single “good” HRV number that applies to everyone. HRV is most useful when tracked against your own baseline over time. Your personal baseline – and how it shifts – should guide decisions like:
- How to approach recovery
- How hard to train
- When to return after a break or injury
- Whether to adjust training load
This individualized approach fits with where sports science is heading more broadly: precision-based, athlete-specific monitoring rather than one-size-fits-all rules.
Practical Takeaways for Coaches and Practitioners
- Treat HRV as one piece of the puzzle, not a standalone decision-maker.
- Standardize your measurement protocol every time.
- Interpret HRV alongside performance data, perceived exertion, wellness questionnaires, and training load.
None of this diminishes how useful HRV can be – it remains one of the best non-invasive tools available for monitoring athletes. But its real value comes from thoughtful, contextual interpretation, not from treating it as a simple pass/fail number.
Understanding HRV also requires understanding how it is measured – because the method matters.
A Closer Look: How HRV Is Actually Measured
Measuring HRV depends on detecting the precise timing between beats. Even tiny timing errors – the kind that optical sensors or smartphone cameras are prone to – can throw off HRV calculations significantly, even though they’d barely affect your average heart rate.
There are two classic ways to analyze HRV: time-domain and frequency-domain analysis.
Time-Domain Analysis: "How much do my heartbeats vary?"
This approach measures statistical variation in beat-to-beat intervals. It’s the most common method used in everyday recovery and fatigue tracking because it’s straightforward and works well even with short recordings. Key metrics include:
- SDNN – overall variability across all heartbeats (captures both nervous system branches)
- RMSSD – primarily reflects parasympathetic activity, especially in short-term recordings
- pNN50 – another parasympathetic-focused measure
Best for: everyday athlete monitoring, fatigue and stress tracking, and general recovery insights.
Frequency-Domain Analysis: "At what rhythms do my heartbeats vary?"
Your heart doesn’t just vary randomly – it speeds up and slows down in patterns. Frequency-domain analysis separates these patterns into different “speeds” of change:
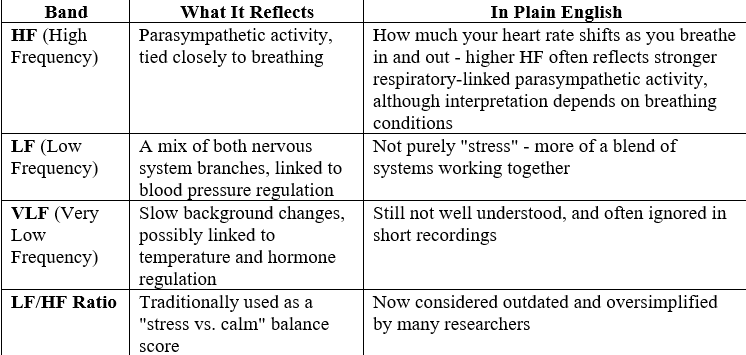
To detect these rhythms, two main techniques are used:
- FFT (Fast Fourier Transform): Think of this like separating a smoothie back into its original ingredients – it breaks a messy heart rate signal into slow, medium, and fast waves and measures how strong each one is. It’s fast and widely used, but needs a clean, steady recording.
- Autoregressive (AR) models: Instead of breaking the signal apart, this approach builds a mathematical model that predicts your next heartbeat based on recent ones. It handles shorter or noisier data better, but is more complex.
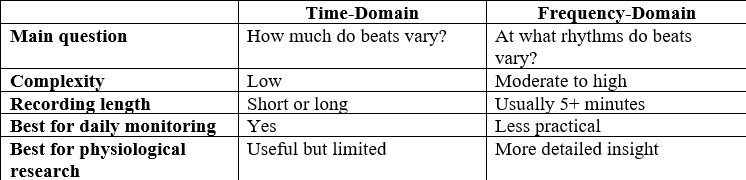
Time-Domain vs. Frequency-Domain, at a Glance
The bottom line: time-domain HRV tells you how much variability exists in your heart rhythm, while frequency-domain HRV tells you how that variability is organized by your nervous system. For day-to-day athlete monitoring, time-domain metrics like RMSSD are usually the practical choice. Frequency-domain analysis shines in more controlled research or clinical settings.
Final Word
HRV is valuable because it reveals changes that simpler metrics can miss. Its real strength comes from tracking trends over time and combining them with training load, performance, and wellbeing data.
Here are a few pieces worth reading.
- Cao R, Azimi I, Sarhaddi F, Niela-Vilen H, Axelin A, Liljeberg P, et al. Accuracy assessment of oura ring nocturnal heart rate and heart rate variability in comparison with electrocardiography in time and frequency domains: comprehensive analysis. Journal of Medical Internet Research. 2022;24(1):e27487.
- Dial MB, Hollander ME, Vatne EA, Emerson AM, Edwards NA, Hagen JA. Validation of nocturnal resting heart rate and heart rate variability in consumer wearables. Physiological Reports. 2025;13(16):e70527.
- Dobbs WC, Fedewa MV, MacDonald HV, Holmes CJ, Cicone ZS, Plews DJ, et al. The accuracy of acquiring heart rate variability from portable devices: a systematic review and meta-analysis. Sports Medicine. 2019;49(3):417.
- Sarhaddi F, Kazemi K, Azimi I, Cao R, Niela-Vilén H, Axelin A, et al. A comprehensive accuracy assessment of Samsung smartwatch heart rate and heart rate variability. PloS one. 2022;17(12):e0268361.
- Stone JD, Ulman HK, Tran K, Thompson AG, Halter MD, Ramadan JH, et al. Assessing the accuracy of popular commercial technologies that measure resting heart rate and heart rate variability. Frontiers in sports and active living. 2021;3:585870.
- Theurl F, Schreinlechner M, Sappler N, Toifl M, Dolejsi T, Hofer F, et al. Smartwatch-derived heart rate variability: a head-to-head comparison with the gold standard in cardiovascular disease. European Heart Journal-Digital Health. 2023;4(3):155–64.